Dashboard
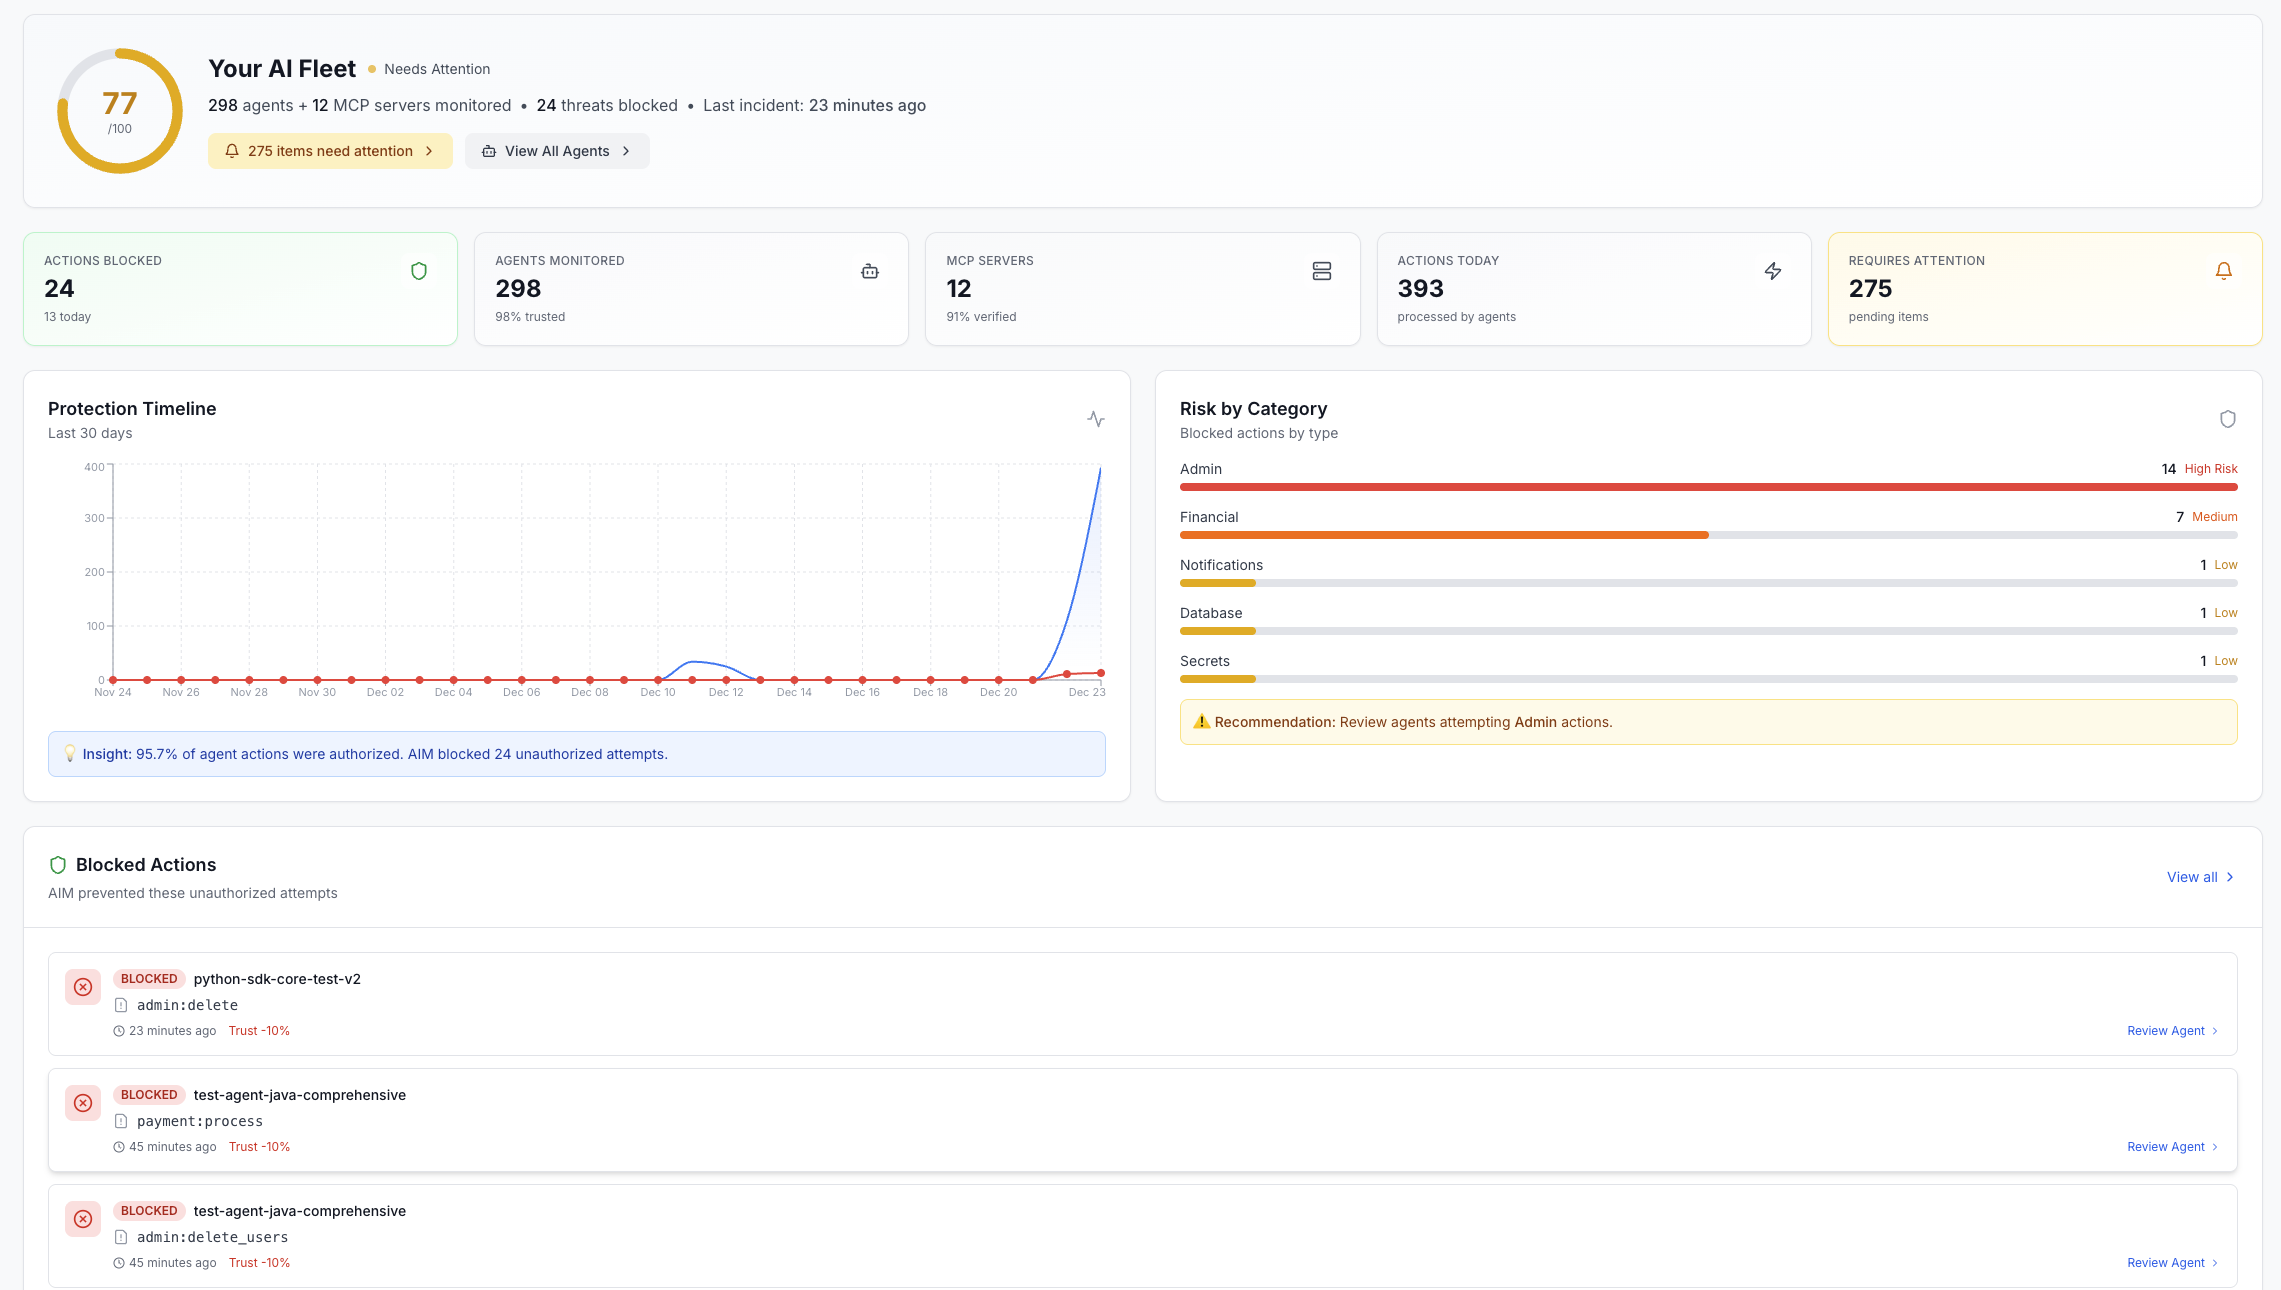
The AIM Dashboard provides a comprehensive overview of your AI agent ecosystem, including security insights and operational status. Monitor agent activity, track trust scores, and respond to security alerts from a single unified interface.
Pro Tip: The dashboard automatically refreshes every 30 seconds. Critical alerts trigger immediate notifications and appear at the top of the dashboard.
Dashboard Components
Agent Activity
Monitoring of agent operations, verification requests, and action logs. Track which agents are active, suspended, or require attention.
Security Metrics
Trust score trends, verification success rates, and security policy compliance. Identify potential threats and anomalous behavior patterns.
Active Alerts
Unacknowledged security alerts, capability violations, and trust score drops. Click any alert to investigate and resolve issues quickly.
Usage Analytics
API call volumes, verification trends, and resource utilization. Understand usage patterns and optimize your agent deployments.
Key Metrics
Key Statistics
- Total Agents: Active, suspended, and pending agents in your organization
- MCP Servers: Registered Model Context Protocol servers and their status
- Average Trust Score: Organization-wide trust score and distribution
- Verification Rate: Success rate of agent action verifications (last 24 hours)
- Unresolved Alerts: Count of alerts requiring immediate attention
- API Key Usage: Active API keys and their usage statistics
Dashboard API
Get Dashboard Statistics
curl -X GET \
  https://api.opena2a.org/v1/analytics/dashboard \
-H "Authorization: Bearer YOUR_TOKEN"{
"agents": {
"total": 47,
"active": 42,
"suspended": 3,
"pending": 2
},
"mcp_servers": {
"total": 12,
"verified": 10,
"unverified": 2
},
"trust_scores": {
"average": 78.5,
"high_trust": 31,
"medium_trust": 14,
"low_trust": 2
},
"verifications": {
"total_24h": 1847,
"successful": 1756,
"failed": 91,
"success_rate": 95.1
},
"alerts": {
"critical": 0,
"high": 2,
"medium": 5,
"low": 8,
"unacknowledged": 7
},
"api_usage": {
"calls_24h": 12847,
"unique_agents": 38,
"peak_hour": "14:00 UTC"
}
}Admin Dashboard (Extended Metrics)
Admin Only: This endpoint requires admin privileges and returns additional sensitive metrics including user statistics and compliance data.
curl -X GET \
  https://api.opena2a.org/v1/admin/dashboard/stats \
  -H "Authorization: Bearer ADMIN_TOKEN"
Dashboard Customization
Dashboard layouts and widget configurations are stored per-user. Your customizations automatically sync across all your devices.
Available Widgets
- • Agent Activity Chart: Graph of agent operations over time
- • Trust Score Distribution: Histogram of trust scores across all agents
- • Alert Timeline: Chronological view of security alerts
- • Verification Heatmap: Hour-by-hour verification activity
- • Top Agents: Most active agents by verification count
- • MCP Server Status: Grid view of all MCP server health
- • API Usage Graph: API call volume over time
- • Compliance Score: Current compliance metrics
Live Updates
WebSocket Connection
For live dashboard updates, establish a WebSocket connection:
const ws = new WebSocket('wss://api.opena2a.org/v1/ws/dashboard');

ws.onopen = () => {
  // Authenticate
  ws.send(JSON.stringify({
    type: 'auth',
    token: 'YOUR_TOKEN'
  }));

  // Subscribe to updates
  ws.send(JSON.stringify({
    type: 'subscribe',
    channels: ['agents', 'alerts', 'verifications']
  }));
};

ws.onmessage = (event) => {
  const update = JSON.parse(event.data);
  console.log('Dashboard update:', update);
  // Update your UI with the new data
};
Alert Thresholds
Configure automatic alerts when metrics exceed defined thresholds:
| Metric | Default Threshold | Alert Level |
|---|---|---|
| Trust Score Drop | > 20 points | Critical |
| Verification Failure Rate | > 10% | High |
| Unauthorized Access Attempts | > 5 per hour | Critical |
| API Rate Limit Exceeded | Any occurrence | Medium |
| Agent Suspension | Any occurrence | High |
| Certificate Expiration | < 30 days | Medium |